

In the dynamic world of e-commerce, achieving sustainable success requires more than just an online presence. It demands a data-driven approach, a keen understanding of key performance indicators (KPIs), and the ability to translate those metrics into actionable strategies. Unlocking e-commerce success hinges on your ability to track, analyze, and optimize the right metrics. This article will delve into the essential e-commerce metrics that empower businesses to make informed decisions, improve operational efficiency, and ultimately drive revenue growth. Understanding these key metrics is the first step toward dominating the competitive e-commerce landscape.
From conversion rates and average order value to customer lifetime value and churn rate, we’ll explore the vital signs of a healthy e-commerce business. By mastering these key metrics, you can identify areas for improvement, personalize the customer experience, and optimize your marketing campaigns for maximum impact. This comprehensive guide will equip you with the knowledge to not only track these crucial indicators but also to interpret their implications and leverage them for e-commerce success.
Understanding the Importance of E-Commerce Metrics
In the dynamic world of e-commerce, data is king. Tracking and analyzing key metrics is essential for understanding your business performance, identifying areas for improvement, and ultimately, driving growth. Without a clear understanding of these metrics, businesses navigate blindly, missing crucial opportunities to optimize their strategies and maximize profitability.
E-commerce metrics provide valuable insights into customer behavior, marketing effectiveness, and overall business health. By regularly monitoring these metrics, you can make informed decisions about pricing, product assortment, marketing campaigns, and website design. This data-driven approach empowers businesses to adapt to changing market conditions, stay ahead of the competition, and achieve sustainable success in the e-commerce landscape.
Choosing the right metrics to track depends on your specific business goals. Whether it’s increasing sales, improving customer retention, or expanding market reach, understanding the relevant metrics is the first step towards achieving those objectives. By focusing on the most impactful data points, you can efficiently allocate resources and optimize your efforts for maximum return.
Conversion Rate: The Ultimate Measure of Success
The conversion rate is arguably the most critical metric for e-commerce businesses. It represents the percentage of website visitors who complete a desired action, typically a purchase. A higher conversion rate signifies a more effective sales funnel and ultimately, greater profitability.
Calculating your conversion rate is straightforward: divide the number of conversions by the total number of website visitors and multiply by 100. For example, if you had 1,000 visitors and 50 sales, your conversion rate is 5%.
Understanding your conversion rate allows you to assess the effectiveness of your marketing campaigns, website design, and overall user experience. A low conversion rate may indicate issues with site navigation, confusing product descriptions, or a cumbersome checkout process.
By consistently monitoring and optimizing your conversion rate, you can identify areas for improvement and maximize your e-commerce success. Even small increases in conversion rate can translate to significant revenue gains.
Average Order Value (AOV): Boosting Your Revenue
Average Order Value (AOV) represents the average amount a customer spends per order on your e-commerce site. Understanding and optimizing your AOV is crucial for driving revenue growth, as even small increases can significantly impact your bottom line.
Calculating AOV is straightforward: divide your total revenue by the total number of orders. This metric provides valuable insights into customer purchasing behavior and highlights opportunities to encourage larger purchases.
Several strategies can effectively boost AOV. Consider implementing product bundles or offering volume discounts to incentivize customers to add more items to their cart. Free shipping thresholds can also encourage customers to spend more to reach the free shipping minimum.
Upselling and cross-selling techniques are also highly effective. Suggesting complementary products or premium versions during the checkout process can significantly increase the average order value. Personalized product recommendations based on browsing history or past purchases can further enhance these efforts.
Customer Lifetime Value (CLTV): Building Long-Term Relationships
Customer Lifetime Value (CLTV) represents the total revenue you can expect from a single customer throughout their relationship with your business. Understanding CLTV is crucial for making informed decisions about sales, marketing, and customer service.
By focusing on CLTV, you shift from short-term transactional thinking to a long-term relationship-building approach. This encourages investment in strategies that foster customer loyalty and repeat purchases.
Calculating CLTV involves considering factors such as average purchase frequency, average order value, and customer lifespan. A higher CLTV indicates a stronger customer relationship and greater profitability.
Strategies for increasing CLTV include personalized marketing campaigns, loyalty programs, and exceptional customer service. By nurturing existing customers, you can maximize their lifetime value and drive sustainable growth.
Example CLTV Calculation:
| Average Purchase Value | $50 |
| Average Purchase Frequency Rate | 4 times per year |
| Average Customer Lifespan | 3 years |
| CLTV | $600 ($50 x 4 x 3) |
Shopping Cart Abandonment Rate: Identifying and Addressing Obstacles
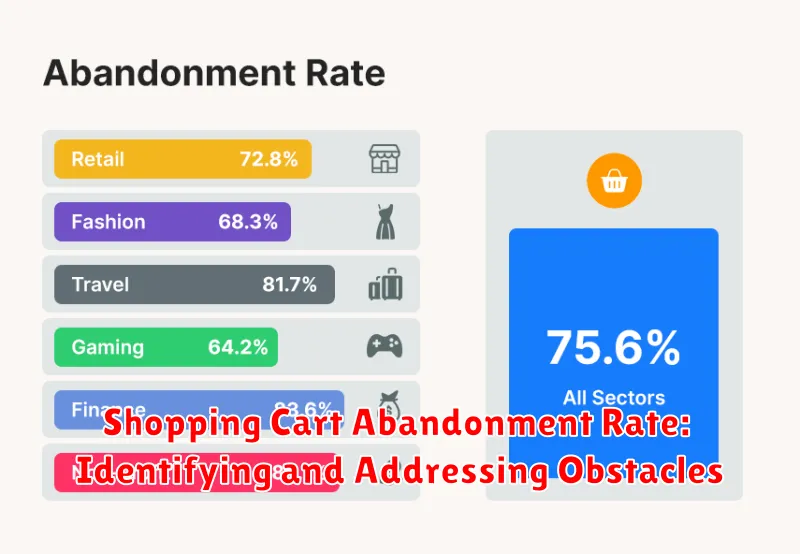
A high shopping cart abandonment rate signifies lost revenue and potential customers. Tracking this metric is crucial for understanding why customers leave without completing their purchase.
Several factors contribute to cart abandonment. Unexpected costs, like high shipping fees or taxes, are a major deterrent. A complicated checkout process with too many steps or required account creation can also frustrate customers.
Addressing these obstacles requires a multi-pronged approach. Offer transparent pricing upfront, displaying all costs early in the process. Streamline your checkout, allowing guest checkout options and minimizing required fields. Implementing cart recovery emails with incentives, such as discounts or free shipping, can entice customers to return and complete their purchases.
By actively monitoring and addressing the reasons behind cart abandonment, you can significantly improve your conversion rate and overall revenue.
Customer Acquisition Cost (CAC): Measuring the Efficiency of Your Marketing Efforts
Customer Acquisition Cost (CAC) represents the total cost a business incurs to acquire a new customer. Tracking CAC is crucial for understanding the effectiveness of your marketing campaigns and overall business profitability.
Calculating CAC involves dividing the total marketing and sales costs associated with acquiring new customers over a specific period by the number of customers acquired during that same period. A high CAC can indicate inefficient marketing strategies, while a low CAC suggests effective resource allocation.
Monitoring CAC helps businesses:
- Optimize marketing spend.
- Identify profitable marketing channels.
- Improve return on investment (ROI).
By analyzing CAC in conjunction with other key metrics, e-commerce businesses can make data-driven decisions to enhance their growth and profitability.
Net Promoter Score (NPS): Gauging Customer Loyalty and Advocacy
The Net Promoter Score (NPS) is a valuable metric for understanding customer loyalty and potential for advocacy. It measures the likelihood of customers recommending your business to others.
Customers are asked a simple question: “On a scale of 0 to 10, how likely are you to recommend [your company name] to a friend or colleague?” Responses are then grouped into three categories:
- Promoters (9-10): These are your loyal enthusiasts, likely to drive repeat business and referrals.
- Passives (7-8): Satisfied but not enthusiastic, they are susceptible to competitive offerings.
- Detractors (0-6): Unhappy customers who may damage your brand through negative word-of-mouth.
Your NPS is calculated by subtracting the percentage of Detractors from the percentage of Promoters. A high NPS generally indicates strong customer loyalty and positive brand perception. Tracking NPS over time allows you to monitor changes in customer sentiment and identify areas for improvement.
Return on Investment (ROI): Evaluating the Overall Profitability of Your E-Commerce Business
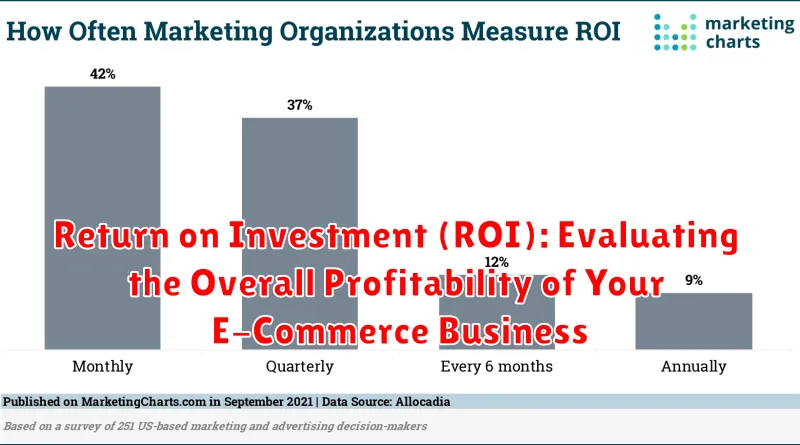
Return on Investment (ROI) is a crucial metric for evaluating the overall profitability of your e-commerce venture. It essentially measures how much profit you generate for every dollar invested.
Calculating ROI involves subtracting your total investment from your net profit, dividing that result by your total investment, and then multiplying by 100 to express it as a percentage. A positive ROI signifies profitability, while a negative ROI indicates a loss.
Tracking ROI is essential for making informed business decisions. By analyzing ROI for different marketing campaigns, product lines, or operational strategies, you can identify what’s working, what’s not, and optimize your resource allocation for maximum return. A higher ROI generally suggests a more efficient and profitable operation.
Example:
- You invest $1,000 in an advertising campaign.
- The campaign generates $5,000 in profit.
- ROI Calculation: (($5,000 – $1,000) / $1,000) * 100 = 400%
Bounce Rate vs Exit Rate
While both bounce rate and exit rate offer insights into user behavior, they represent distinct actions and provide different perspectives on website performance.
Bounce rate represents the percentage of single-page sessions where a user enters a website and leaves without interacting with any other page on the site. A high bounce rate can indicate issues with site design, irrelevant content, or poor user experience. For example, a user landing on a product page and immediately leaving without viewing other products, adding the item to their cart, or initiating checkout contributes to the bounce rate.
Exit rate, on the other hand, represents the percentage of page views that were the final view in a session. This metric indicates the frequency with which users leave your site from a specific page. A high exit rate for a particular page isn’t necessarily negative. For instance, a high exit rate on the order confirmation page is expected, as users typically leave the site after completing their purchase.
Understanding the difference between these two metrics is crucial for effective website analysis. By analyzing both bounce rate and exit rate, you can identify areas for improvement and optimize the user journey throughout your e-commerce platform.